Two cursors are available to measure the displayed curves. When the diagram is selected and the cursors are active, the hooks of the cursors are displayed. Cursor hooks are yellow boxes displayed at the ends of the cursor line. Drag the cursor hooks to change its position along the curve. Each cursor has two measurement lines, one horizontal and one vertical.
To view the position of the cursors
The position of the cursors is displayed as follows:
When the mouse pointer is over a cursor hook, the cursor position is displayed on the status bar.
The cursor position is always displayed in the cursor window. To activate the cursor window choose the View » Cursors command.
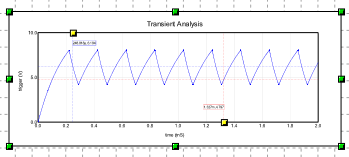
The position of the cursors can be displayed directly in the diagrams by activating the Show Label on the cursor option, present in the diagram properties window.
To activate the cursors in the diagrams
In order to use the cursors, they must be activated and connected to the curve on which the measurements are to be made.
Activate cursors from the diagram properties window
You can activate cursors from the diagram properties window as follows:
Select the diagram.
-
Open the Object properties: Diagram window in one of the following ways:
Double-click on the diagram.
-
Press the key combination ALT+Enter.
Click the
 button in the toolbar.
-
Activate the context menu with the right mouse button and choose the command Properties.
-
In the Graph tab, scroll through the list of parameters to the Cursors section.
-
Activate one or both cursors. To display the coordinates of the cursor directly in the diagram also activate the option Show Label on the cursor.
-
Activate the Vectors tab. To attach the cursor to a vector, tick box A or box B on the vector line.
Activate cursors from menu
You can activate cursors from the menu as follows:
Select the diagram.
Activate the context menu with the right mouse button and display the submenu Diagram.
Choose the Cursor A » Cursor A command to activate/deactivate cursor A.
Choose the command Cursor B » Cursor B to activate/deactivate the cursor B.
Enable cursors from the toolbar
If the Diagram toolbar is displayed, you can enable cursors as Follows:
To activate/deactivate cursor A, click the
 button in the toolbar.
To activate/deactivate cursor B, click the button in the toolbar.
To change the position of the cursors in the diagrams
The cursor position can be varied in various ways.
Place cursors with the mouse
When the diagram is selected and the cursors are active, the hooks of the cursors are displayed. Cursor hooks are yellow boxes displayed at the ends of the cursor line. Drag the cursor hooks to change its position along the curve. If the cursor is not hooked to any vector, two hooks are displayed that allow you to change the horizontal and vertical positions independently. If the cursor is hooked to a curve, only the hook controlling the horizontal position is displayed, the vertical position is equal to the value assumed by the vector.
Position the cursor accurately
You can position the cursor on a given x-axis value in the following way:
Select the Diagram.
Activate the context menu with the right mouse button and display the submenu Diagram.
Choose the Cursor A » Set cursor A command to set cursor A.
Choose the command Cursor B » Set cursor B to set the cursor B.In the dialog box, specify the value of the horizontal position of the cursor.
Reset cursor position
You can reset the cursor position as follows:
Select the diagram.
Activate the context menu with the right mouse button and display the submenu Diagram.
Choose the Cursor A » Reset cursor A command to place cursor A in the upper left corner of the graph.
Choose the Cursor B » Reset cursor B command to position cursor B in the lower right corner of the graph.
Save and restore cursor position
You can save the current location of the cursor so that you can restore it later:
Select the diagram.
Activate the context menu with the right mouse button and display the submenu Diagram.
Choose the command Cursor A » Store cursor A to save the position of cursor A.
Choose the command Cursor B » Store cursor B to save the position of cursor B.
You can then reset the cursor position as follows:
Select the diagram.
Activate the context menu with the right mouse button and display the submenu Diagram.
Choose the Cursor A » Restore cursor A command to restore cursor A position.
Choose the Cursor B » Restore cursor B command to restore cursor position B.
Position the cursor on the characteristic points of the curve
You can place the cursor on one of the simulation data as follows:
Select the diagram.
Activate the context menu with the right mouse button and display the Diagram submenu then choose one of the commands listed below or click on the corresponding button on the toolbar.
Peak

Find the next peak on the selected curve.
Valley

Find the following valley on the selected curve.
Max

Find the largest value from the selected curve data.
Min

Find the smallest value from the selected curve data.
Inflection

Find the next inflection point on the selected curve.
Next point

Place the cursor on the next data point.